Table 3. Kinetic Parameters of the VEGF system (Control Values).
| Compartment | In Vitro Measurements | Simulation Control Values (In Vivo Conversions) | ||||
| Culture Medium | Blood | Normal | Healthy Calf | Unit | ||
| Value | Unit | Value | Value | Value | ||
| VEGF binding to VEGFR1 | ||||||
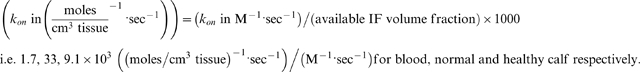
| kon | 3·107 | M−1 s−1 | N/A | 1012 | 2.73·1011 | (mol/cm3 tissue)−1s−1 |
| koff | 10−3 | s−1 | ||||
| Kd | 3.33·10−11 | M | N/A | 10−15 | 3.67·10−15 | mol/cm3 tissue |
| VEGF binding to VEGFR2 | ||||||
| kon | 107 | M−1 s−1 | N/A | 3.33·1011 | 9.09·1010 | (mol/cm3 tissue)−1s−1 |
| koff | 10−3 | s−1 | ||||
| Kd | 10−10 | M | N/A | 3·10−15 | 1.1·10−14 | mol/cm3 tissue |
| VEGF121 binding to NRP1 | ||||||
| kon | 0 | M−1 s−1 | ||||
| koff | 0 | s−1 | ||||
| Kd | N/A | M | ||||
| VEGF165 binding to NRP1 | ||||||
| kon | 3.125·106 | M−1 s−1 | N/A | 1.04·1011 | 2.84·1010 | (mol/cm3 tissue)−1s−1 |
| koff | 10−3 | s−1 | ||||
| Kd | 3.2·10−10 | M | N/A | 9.6·10−15 | 3.52·10−14 | mol/cm3 tissue |
| VEGF165 binding to GAG | ||||||
| kon | 4.2·105 | M−1 s−1 | N/A | 1.4·1010 | 3.82·109 | (mol/cm3 tissue)−1s−1 |
| koff | 10−2 | s−1 | ||||
| Kd | 2.38·10−8 | M | N/A | 7.14·10−13 | 2.62·10−12 | mol/cm3 tissue |
| VEGFR1 coupling to NRP1 | ||||||
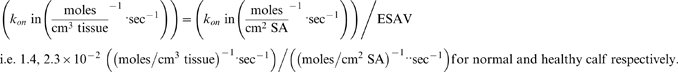
| kc | 1014 | (mol/cm2)−1s−1 | N/A | 1.37·1012 | 2.27·1012 | (mol/cm3 tissue)−1s−1 |
| kdissoc | 10−2 | s−1 | ||||
| VEGF·VEGFR2 coupling to NRP1 | ||||||
| kc | 3.1·1013 | (mol/cm2)−1s−1 | N/A | 4.25·1011 | 7.05·1011 | (mol/cm3 tissue)−1s−1 |
| koff | 10−3 | s−1 | ||||
| VEGF·NRP1 coupling to VEGFR2 | ||||||
| kc | 1014 | (mol/cm2)−1s−1 | N/A | 1.37·1012 | 2.27·1012 | (mol/cm3 tissue)−1s−1 |
| koff | 10−3 | s−1 | ||||
| VEGF binding to sVEGFR1 * | ||||||
| kon | 3·107 | M−1 s−1 | 5·1010 | 1012 | 2.73·1011 | (mol/cm3 tissue)−1s−1 |
| koff | 10−3 | s−1 | ||||
| Kd | 3.33·10−11 | M | 2·10−14 | 10−15 | 3.67·10−15 | mol/cm3 tissue |
| sVEGFR1 coupling to GAG † | ||||||
| kon | 4.2·105 | M−1 s−1 | 7·108 | 1.4·1010 | 3.82·109 | (mol/cm3 tissue)−1s−1 |
| koff | 10−2 | s−1 | ||||
| Kd | 2.38·10−8 | M | 1.43·10−11 | 7.14·10−13 | 2.62·10−12 | mol/cm3 tissue |
| sVEGFR1 binding to NRP1 ‡ | ||||||
| kon | 5.56·106 | M−1 s−1 | 9.26·109 | 1.85·1011 | 5.05·1010 | (mol/cm3 tissue)−1s−1 |
| koff | 10−2 | s−1 | ||||
| Receptor Internalization | ||||||
| kint,R (free receptors) | 2.8·10−4 | s−1 | ||||
| kint,C (bound receptors) | 2.8·10−4 | s−1 | ||||