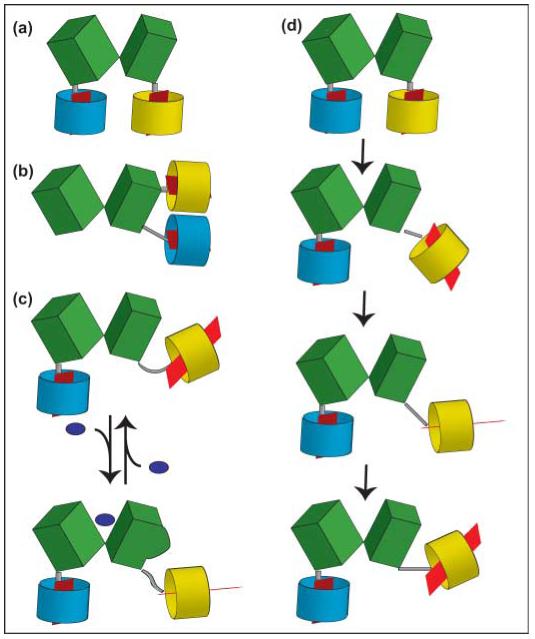
Fig. 5.

Schematic models of fluorescence resonance energy transfer (FRET) sensors for metabolites. A recognition element, for example a periplasmic binding protein, here consisting of two lobes (green), is coupled to a cyan version of green fluorescent protein (GFP) (cyan barrel) at its N-terminus and to a yellow version of GFP (yellow barrel) at its C-terminus. The red plane inside the barrel indicates the orientation of the dipole (note: dipole orientation is crucial; see k2 in Förster equation); the gray bar represents the linker. (a) C- and N-termini are separated and are located at the bottom of the two lobes of the recognition element (e.g. FRET glucose sensors). (b) C- and N-termini are located on the same lobe of the recognition element (e.g. FRET phosphate sensors). (c) Binding of the ligand to the recognition element leads to a conformational change on the surface of the recognition element, deflecting yellow fluorophore. (d) If not carried out in single-molecule mode, FRET analysis averages over many molecules and many positions of the molecules over time (here only shown for the yellow fluorophore). Thus the analysis averages over many dipole orientations (note positions of red dipole), and the flexible linker and 3D structure of the recognition element determine the freedom of the fluorophore to take different positions and to rotate. Thus, if binding affects the surface of the recognition element as in (c), the number of productive interactions between the dipoles will change, leading to a FRET change. This model may explain the mechanism behind how the sensors, including the one shown in (b), can be functional.
