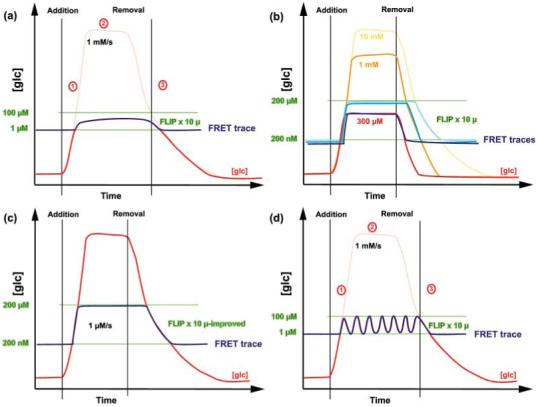
Fig. 8.

Flux analysis using fluorescence resonance energy transfer (FRET) sensors (Part II). (a) If the external concentration of glucose (glc) is reduced so that the intracellular concentrations fall into the detection interval of the sensor, a concentration-dependent response of a given sensor, here FLIP x 10 μ, can be observed. (b) Red, orange and yellow traces correspond to different hypothetical accumulation, steady-state and elimination rates as the external supply varies. Traces for each of the different accumulation scenarios are shown in three shades of blue. (c) Improvements in the dynamic range of the sensor response (larger FRET change compared with (a) provides a larger detection range). (d) Provided that adequate acquisition frequencies are applied, the sensor can detect potential oscillations of the glucose concentration.
