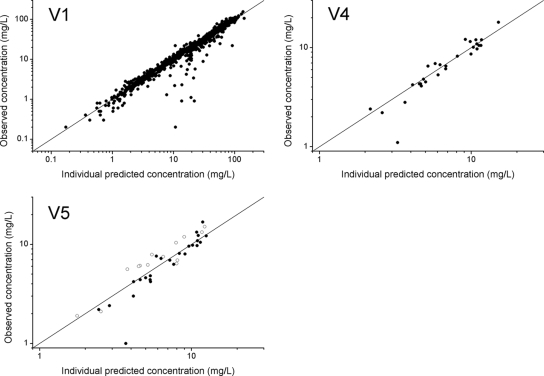
FIG. 3.
Individual predicted versus observed concentrations of amoxicillin for the central compartment of the mother (V1), the venous umbilical cord compartment (V4), and the neonatal compartment (V5). Scatter plots of the individual predicted concentrations versus the observed concentrations of amoxicillin for 44 patients (V1), 28 measures of the venous umbilical cord (V4), and 25 measures of the arterial umbilical cord with 14 measures for the neonates (V5). The open symbols in V5 represent the neonatal serum concentrations, and the filled symbols represent the arterial umbilical cord concentrations. The three panels show the individual data points and the line of identity (x = y).

