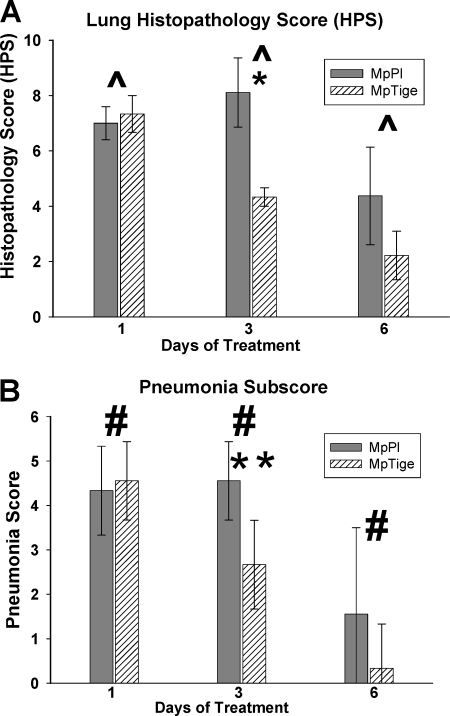
FIG. 2.
Lung HPS (A) and pneumonia subscore (B) of MpTige or MpPl mice. The values shown are means ± standard deviations (error bars). The data represent the results from two separate experiments with 10 mice in each group at each time point. ^, P = 0.035 by two-way ANOVA; #, P = 0.004 by two-way ANOVA; *, P = 0.002 for HPS between MpPl mice by t test; **, P = 0.004 for pneumonia subscore between MpTige and MpPl mice by t test.

