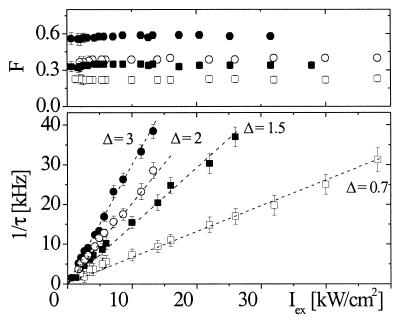
Figure 2.
Iex dependence of flicker-fraction F and rate τe−1 at low excitation levels for T203Y (●,■), and T203F (○, □) using 514 (circles) and 488 (squares) nm at pH 8. The rates depend linearly on Iex and show no significant residual amplitude as Iex→0. The F values are constant within experimental errors of ca. 5%. The plotted slopes Δ (cm2⋅kW−1⋅ms−1) are obtained by linear least-squares fitting.

