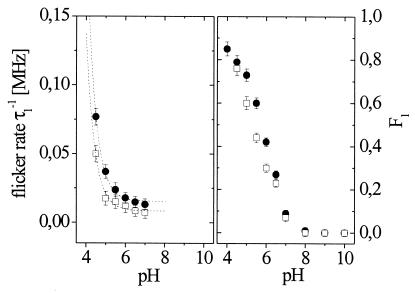
Figure 4.
pH dependence of the protonation kinetics of T203Y (□) and T203F (●) at low Iex. Fitting the flicker rate (Left, dashed line) allows determination of protonation and deprotonation rate constants as described in the text. The fraction of dark state (Right) is a measure of protonation equilibrium constants.

