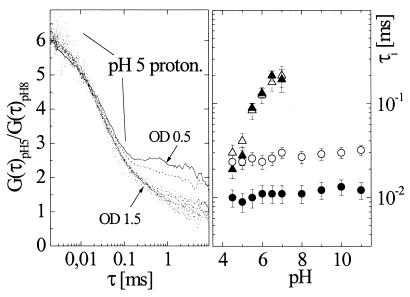
Figure 5.
(Left) Correlation function ratios distinguish fluctuations because of protonation from excitation-driven flicker. The plot shows correlation curves of T203Y at pH 5 divided by those at pH 8, both recorded at the same intensity, for 10 different Iex in OD 0.1 steps. The ratiometric shoulder at short correlation times represents protonation kinetics at pH 5. The differences at long correlation times are caused by photobleaching of the unprotonated state only (see text). (Right) pH dependence of τ1 (protonation; ▴,▵) and τ2 (excitation-induced flicker; ●,○) for two different intensities Ia =100 kW/cm2 (filled) and Ib =33 kW/cm2 (open). Each time constant appears dependent on only one parameter, either Iex for τ2 or pH for τ1.

