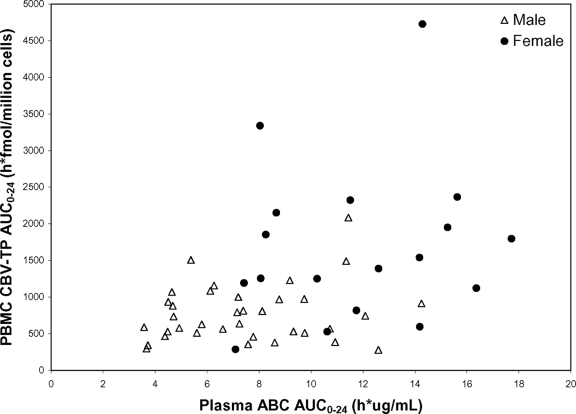
FIG. 2.
Relationship between plasma ABC AUC0-24 and intracellular CBV-TP AUC0-24. Data from both ABC 600 mg QD and ABC 300 mg BID treatments are included. Data from both females (solid circles) and males (open triangles) are presented. A significant correlation between plasma ABC and intracellular CBV-TP AUC0-24 values was found when all data were used (P < 0.01 based on regression of log-transformed data); however, when gender was included in the regression model, no significant association was detected.

