FIG. 3.
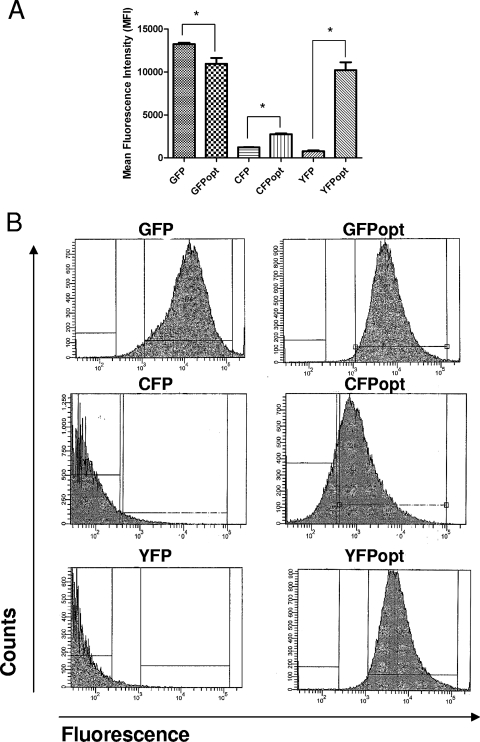
FACS analysis of bacteria expressing original and codon-optimized FPs. B. anthracis Ames 33 carrying pSW4 plasmids with the respective fluorescent genes were grown overnight in LB and subjected to analysis by flow cytometry. (A) Comparison of MFIs of bacteria. All differences were statistically significant (P = 0.0309, GFP versus GFPopt; P < 0.0001, CFP versus CFPopt; P = 0.0005, YFP versus YFPopt). Error bars indicate standard deviations. (B) FACS detection of B. anthracis vegetative cells expressing FPs.

