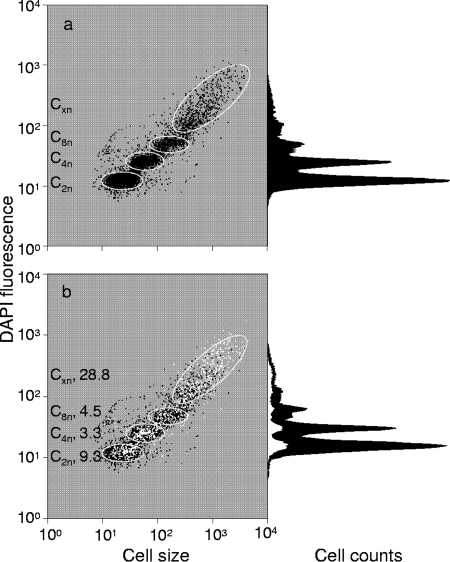
FIG. 2.
Pattern of DNA distributions within a DAPI-stained culture (a) and a DAPI/TC-stained culture (b) of M. phosphovorus. DAPI-stained cells are shown in black. Prominent subpopulations characterized by distinct DNA contents are marked with gates (white ellipses). PAOs within the sample are marked with white dots in the dot plot and as a white area in the histogram; the percentage of the PAOs in subpopulations is given on the left side of panel b.

