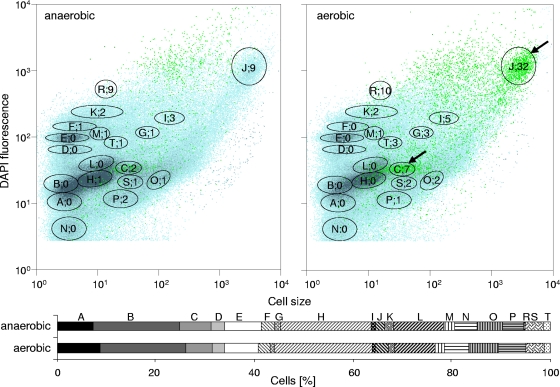
FIG. 3.
Pattern of DNA distributions (blue, with dominant subcommunities marked with black gates) and PAO distribution (green dots and numbers within the gates [percent]) of cells harvested from the anaerobic and aerobic cultivation phases and double stained with DAPI and TC. Subcommunities with a high PAO content are marked with arrows. The amount of cells within each subcommunity is shown in the lower part as two bars for the respective cultivation phases.

