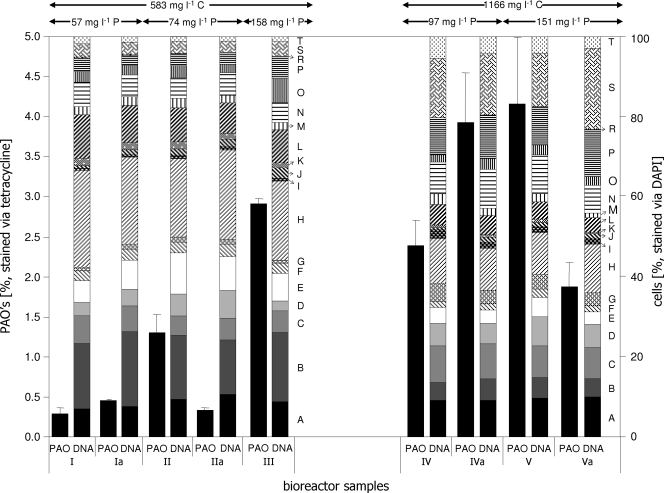
FIG. 4.
DNA pattern (right panel; labels correspond to those in Fig. 3) and proportions of PAOs (left panel) of an activated sludge community cultivated in the SBR for 32 days. The cells were harvested from the aerobic cultivation phase and double stained with DAPI and TC. Phosphorous and carbon concentrations were varied as indicated at the top.

