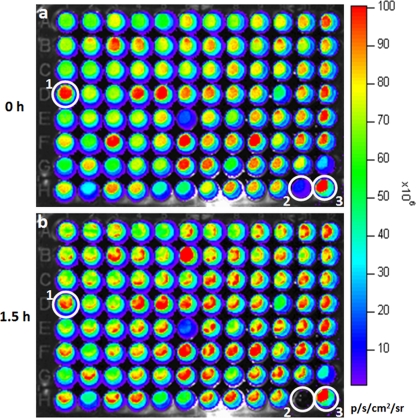
FIG. 2.
Representative image of bioluminescence mutant screening. The 96-well plate shown is from the serum screening experiment and contained 94 mutants, a serum-susceptible control (circle 2, E. coli DH5α), and a serum-resistant control (circle 3, E. ictaluri 93-146). Using this image, the amount of bioluminescence was quantified from each well at 0 h and at 1.5 h, and the percent change in bioluminescence for each individual mutant was used to determine serum sensitivity relative to the serum-resistant control. On the plate shown, one mutant (circle 1) demonstrated reduced bioluminescence at the end of serum incubation (1.5 h) compared to the initial value (0 h). Parent strain 93-146 and all of the other mutants on this plate had slightly increased bioluminescence over the 1.5 h of incubation. Bioluminescence scale is shown in the bar on the right.

