FIG. 3.
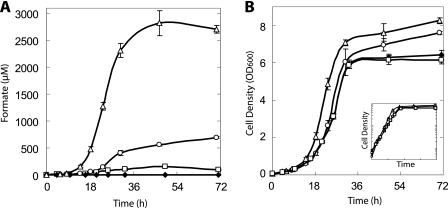
Formate secretion and growth of the engineered S. cerevisiae strains. Formate concentrations and cell densities were assayed at different time points using the different S. cerevisiae strains listed below. (A) Residual formate concentrations in the media. (B) Growth curves of the different strains. The inset illustrates the growth on a logarithmic scale. The initial pH was 6.5 and reached a final value of 6.35 ± 0.05. ⧫, PSY580a; □, PSY3646 (ΔFDH1 ΔFDH2); ○, PSY3648 (PFL); ▵, PSY3649 (PFL and AdhE). The error bars indicate standard deviations of three replicates.

