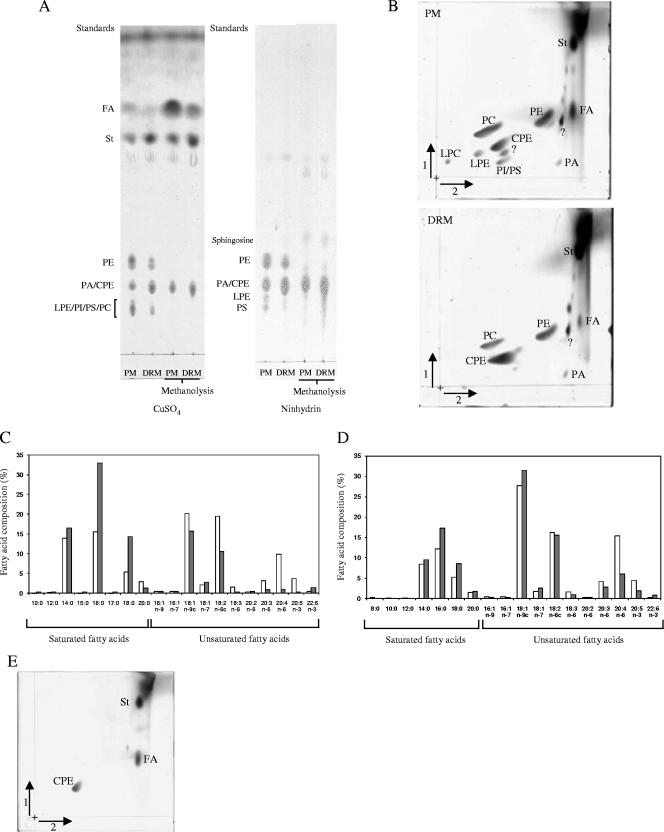
FIG. 4.
Lipid analyses of plasma membranes and DRMs. (A) The lipids from plasma membranes (PM) and DRMs were analyzed by 1D-TLC before or after alkaline methanolysis. All lipids were stained with CuSO4, whereas ninhydrin was used to detect specifically lipids containing free amino groups. The position of standards of a known identity is indicated at the left of each chromatogram. PA, phosphatidic acid; PI, phosphatidylinositol; PS, phosphatidylserine; FA, fatty acids; St, sterols; CPE, ceramide-phosphorylethanolamine. (B) Analysis of the lipids from plasma membranes (PM) and DRMs by 2D-HPTLC (staining with CuSO4). All lipids are abbreviated as in panel A or as defined in the text. Question marks indicate unidentified lipids. (C) Analysis of the fatty acids in the glycerophospholipid fraction (pool of PC, PI, PS, LPE, and LPC) of plasma membranes (□) and DRMs (░⃞). The results are expressed as a percentage of the total fatty acids identified in glycerophospholipids from plasma membranes and DRMs. The data from a typical experiment of five independent analyses are shown. In the case of fatty acids representing <2% of the total fatty acids, the standard deviation did not exceed 50%; a maximum of 15% standard deviation was obtained for fatty acids occurring in proportions higher than 2%. c, double bond with a cis configuration. The percentage of total saturated fatty acids in the glycerophospholipids from the plasma membrane was 35% as opposed to 65% in the DRMs. (D) Same as in panel C, but in the case of the fatty acids present in the PE fraction. (E) 2D-HPTLC of methanolyzed lipids from DRMs stained with CuSO4; identical results were obtained with the lipids from plasma membranes (not shown). Lipid abbreviations are as in panel A.

