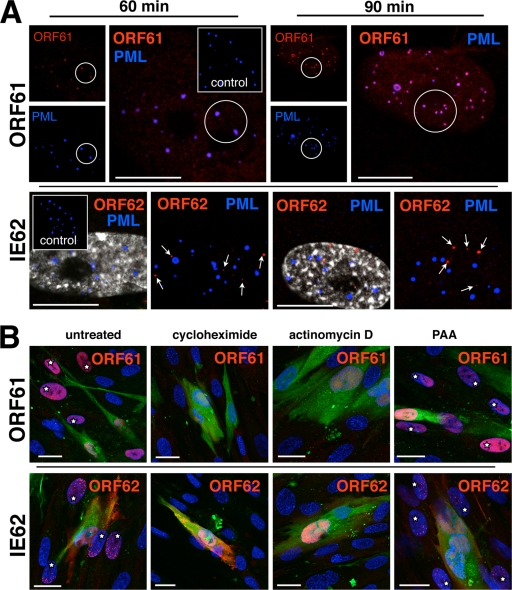
FIG. 3.
ORF61 and IE62 proteins are targeted to different subnuclear compartments and require active transcription and translation but not viral DNA synthesis for very early expression. (A) Unlabeled HELF cells were infected and fixed after 60 min (left panels) or 90 min (right panels). The cells were then double stained with either a combination of rabbit polyclonal anti-ORF61 antibody (upper panels, red) and anti-PML (blue; monoclonal mouse) or with rabbit polyclonal anti-IE62 (lower panels, red) and anti-PML (blue; monoclonal mouse). Secondary antibodies were donkey anti-rabbit Alexa Fluor 546 and donkey anti-mouse Alexa Fluor 647. Uninfected control cells (insets) were stained with the same antibody combinations. The small images in the ORF61 panels show single-PML (blue)- or ORF61 (red)-staining patterns that completely overlap (pink) in the larger overlay images. The two images shown in the IE62 panels (at 60 min or 90 min) depict the same nucleus. In the images on the left, nuclear staining (Hoechst 22358) is shown with the IE62 (red) and PML (blue) signals to clearly mark the nuclear areas. In the images on the right, the nuclear staining was left away for better visibility of the IE62 punctae (red; white arrows) that do not overlap with the PML signal (blue). Scale bars are 10 μm. (B) Uninfected HELF cells were pretreated for 30 min with cycloheximide, actinomycin D, or PAA or left untreated (control) and then inoculated with infected, untreated, green-labeled input cells. Incubation occurred in the presence of the same drugs and was stopped by fixation at 4 h. Cells were then stained for either ORF61 (red, upper panels) or IE62 (red, lower panels), and nuclei (blue) were counterstained with Hoechst 22358. Output cells adjacent to infected inoculum cells (green cytoplasmic staining plus red nuclear staining of ORF61 or IE62) were analyzed for nuclear expression of ORF61 or IE62 (red). Nuclear ORF61 or IE62 (red) is visible in several newly infected cells (white stars) in either the control (far left panels) or the PAA-treated cells (far right panels) but not in the cycloheximide- or actinomycin D-treated cells (middle panels). Scale bars are 20 μm.

