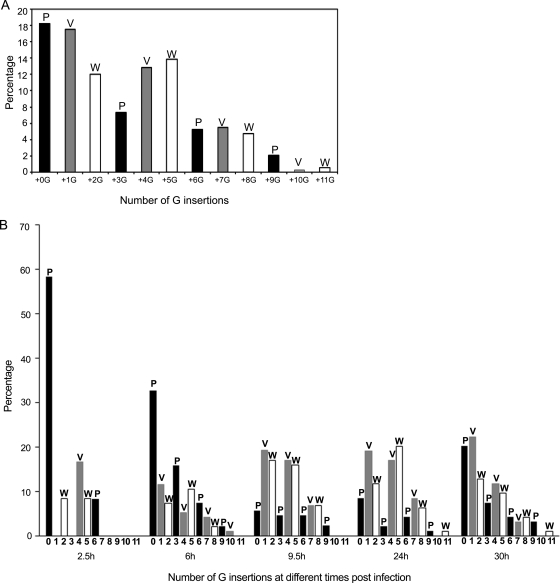
FIG. 3.
The editing frequency of the NiV P gene and the pattern of G insertions. The percentages of unedited (+0G) and edited (+1G to +11G) NiV P-gene transcripts are illustrated either over the entire infection course (A) or at the different times postinfection (B). The encoded protein is indicated above each bar. These data encompass the duplicate infections shown in Fig. 2 (383 clones in total), and for the 2.5-, 6-, 9.5-, 24-, and 30-h time points, the data are compiled from 12, 95, 88, 94, and 94 clones, respectively.

