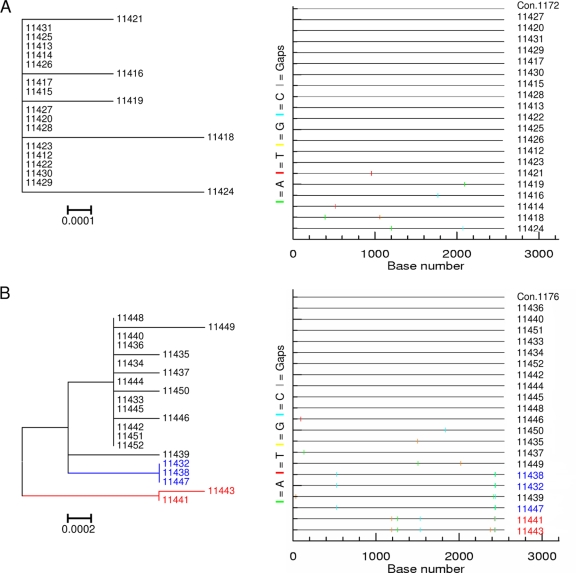
FIG. 3.
env sequence diversity was visually determined by the structure of the phylogenetic tree (left), and the pattern of nucleotide base mutations within sequences was observed on a Highlighter plot (right). The Highlighter plots compare sequences from each participant's sequence set to an intraparticipant consensus (uppermost sequence) and illustrate the positions of nucleotide base transitions and transversions using short, color-coded bars. (A) Participant 1172 with a highly homogeneous env sequence population displaying limited structure on a tree and a few nucleotide changes from the intraparticipant consensus. (B) Participant 1176 infected with three closely related env populations (indicated in black, blue, and red, respectively) based on the clustering of sequences into individual clades on a tree and the shared patterns of mutations observed on a Highlighter plot. Both participants were viral RNA positive but ELISA negative (stage I/II of infection).

