FIG. 5.
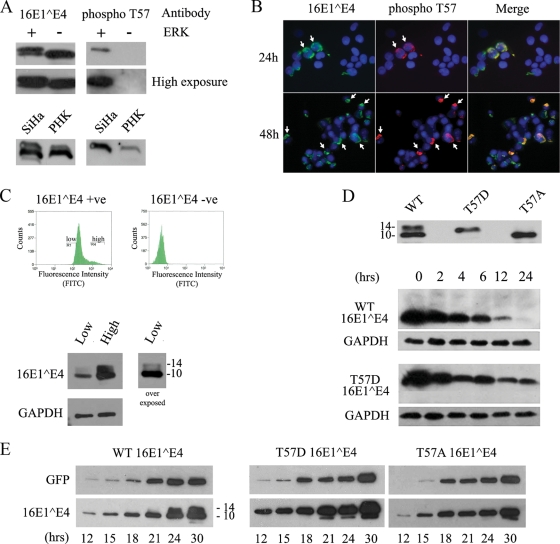
T57 phosphorylation increases the stability and abundance of full-length 16E1^E4 in the cell. (A) His-16E1^E4 was incubated at 30°C in the presence (+) or absence (−) of ERK for 1 h and analyzed by Western blotting using antibodies to 16E1^E4 or to T57-phosphorylated 16E1^E4 (phospho T57). High- and low-level exposures of these blots are shown, demonstrating that the phosphospecific antibody did not detect unphosphorylated E1^E4 (upper panels). SiHa or PHK cells were infected with rAd16E1^E4 for 24 h, and cell lysates were analyzed by Western blotting using antibodies to 16E1^E4 or to T57-phosphorylated 16E1^E4. The antibody to T57-phosphorylated 16E1^E4 detects only the slower-migrating band, confirming that this band is the T57-phosphorylated form of 16E1^E4 (lower panels). (B) SiHa cells were infected with rAd16E1^E4 for 24 or 48 h, fixed with 5% formaldehyde, and triple stained with antibodies to total 16E1^E4 (green) and T57-phosphorylated 16E1^E4 (red) and with DAPI (4′,6-diamidino-2-phenylindole; blue). T57-phosphorylated 16E1^E4 appeared only in cells containing abundant E1^E4 (shown by arrows). Images were captured using a 20× objective. (C) SiHa cells were infected with rAd16E1^E4 for 24 h, and then the SiHa cells expressing high and low levels of E1^E4 were separated by FACS and analyzed by Western blotting with antibodies against 16E1^E4 and GAPDH (as a loading control). Fluorescence intensity correlated with protein abundance and the presence of the T57-phosphorylated (slower-migrating) E1^E4 form. The molecular masses of 16E^E4 forms (in kilodaltons) are shown to the right of the lower panel. +ve, positive; −ve, negative; FITC, fluorescein isothiocyanate. (D, top panel) SiHa cells were transfected with a 16E1^E4 WT-, T57A-, or T57D-expressing plasmid for 24 h prior to SDS-PAGE and Western blotting to reveal the different migration patterns. The molecular masses of 16E1^E4 forms (in kilodaltons) are shown to the left. (Bottom panels) SiHa cells were transfected with a 16E1^E4 WT- or T57D-expressing plasmid for 24 h before being treated with 40 μg/ml cycloheximide for 0, 2, 4, 6, 12, or 24 h prior to harvest. Equal volumes of the soluble protein fraction were analyzed by Western blotting to show the increased stability of 16E1^E4 T57D relative to those of the non-T57-phosphorylated WT 16E1^E4 and the GAPDH loading controls. The results shown are typical of results from triplicate experiments. (E) SiHa cells were cotransfected with a plasmid expressing either T57A, T57D, or WT 16E1^E4 and the GFP-expressing plasmid pXJ-GFP (as a transfection control). Cells were harvested at multiple time points posttransfection, as indicated. Total extracts were run on SDS-polyacrylamide gels and analyzed with antibodies against GFP and 16E1^E4 to show the accumulation of 16E1^E4 in the cell. The time course shows the more rapid accumulation of the T57D (phosphomimic) form than of the WT 16E1^E4 (which lacks a T57-phosphorylated form before the 24-h time point) and the 16E1^E4 T57A mutant (which lacks the T57 phosphorylation site). The results shown are typical of results from triplicate experiments. The molecular masses of 16E1^E4 forms (in kilodaltons) are shown to the right (left panel).

