Figure 4.
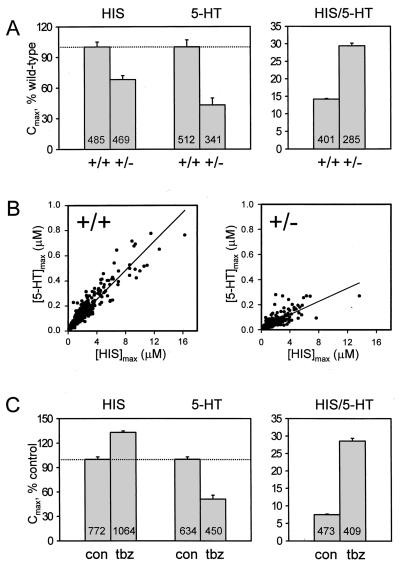
Analysis of histamine and 5-HT concentration spike amplitudes observed by cyclic voltammetry during exocytosis at mast cells. (A) Effects of reduced VMAT2 expression on histamine and 5-HT FSCV spike amplitudes. (Left) A comparison of mean histamine and 5-HT spikes (Cmax)for secretion measured from VMAT2+/+ (n = 13 cells of two mice) and VMAT2+/− (n = 12 cells of two mice) mast cells. Data are expressed as percent of wild-type response with the dashed line showing 100%. (Right) The mean ratio of histamine to 5-HT for simultaneously occurring spikes from the two genotypes. (B) Scatterplots of 5-HT Cmax versus histamine Cmax for temporally coincident secretory spikes measured at VMAT2+/+ and VMAT2+/− mast cells. For VMAT2+/+ cells (401 spikes from 13 cells of two mice), linear regression line has slope of 0.06 and correlation coefficient of 0.94. For VMAT2+/− data (285 spikes from 12 cells of two mice), the slope is 0.03 and correlation coefficient is 0.77. (C) Effects of inhibition of VMAT2 on histamine and 5-HT FSCV spike amplitudes. (Left) A comparison of mean histamine and 5-HT spike Cmax for secretion from VMAT2+/+ mast cells, both untreated (con, n = 10) and incubated with 10 μM TBZ for 24 hr (n = 11). Data are expressed as percent of control response with dashed lines showing 100%. (Right) Mean ratio of histamine Cmax to 5-HT Cmax for simultaneously occurring spikes of control and TBZ-treated cells. Error bars are SEM. The number of spikes detected and analyzed under each condition is shown on the bar.

