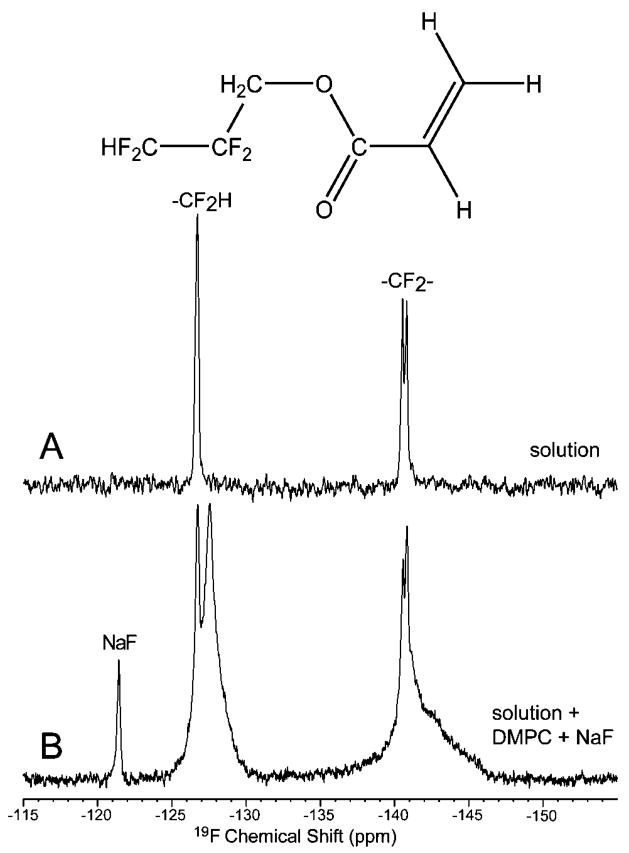
Figure 2.
Nonspinning 19F NMR spectra at 4.7 T demonstrating binding of TFPA to the DMPC membrane. NaF was used as an external (A) and internal (B) reference at −121.5 ppm. Spectrum A was recorded from a 20 mmol/L TFPA solution in water, while spectrum (B) was acquired after the TFPA solution was added to prepared DMPC lipid bilayers in water solution. Neither sample spinning nor proton decoupling was employed; yet, spectral resolution suffices to quantify partitioning of TFPA between phases.

