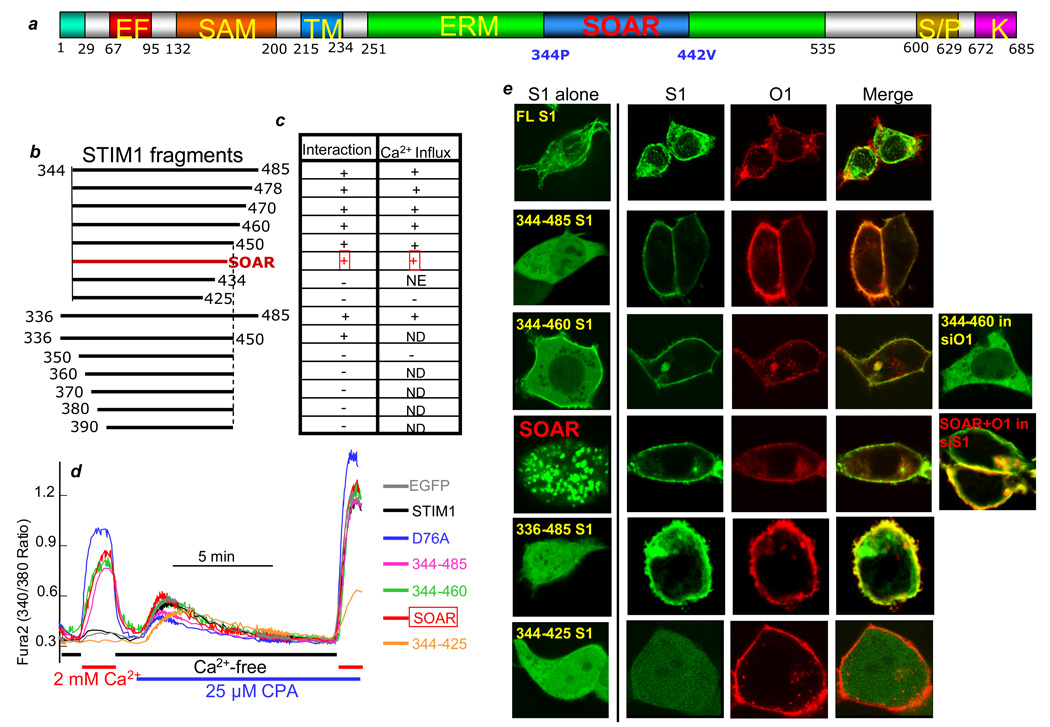
Fig. 1. Interaction of SOAR and STIM1 fragments with Orai1 and activation of SOCs.
(a) A model of STIM1 domains showing the position of SOAR. (b) The STIM1 fragments analyzed in the present work. (c) Summary of the STIM1 fragments interaction with Orai1 (first column) and activation of spontaneous Ca2+ influx (second column). “+” indicates activation of spontaneous Ca2+ influx; “−“ indicates lack of activation of spontaneous Ca2+ influx and inhibition of the native SOC; NE indicates no effect on spontaneous Ca2+ influx or SOCs; and ND indicates not determined. (d) Example traces of HEK cells transfected with EGFP or the indicated EGFP-tagged STIM1 fragments that were incubated in Ca2+-free and then Ca2+-containing media to evaluate the spontaneous Ca2+ influx. The cells were then treated with 25 µM CPA in Ca2+-free media to estimate the ER Ca2+ content and finally the cells were incubated with 25 µM CPA and 2 mM Ca2+ to measure the fully activated SOCs. The traces are representative of 4 experiments, which were used to generate the activity in the table in (c). (e) Localization of the STIM1 fragments when transfected alone (first image in each series) and when co-transfected with Orai1. Also shown is expression of STIM1(344–460) in cells treated for 72 hrs with siOrai1 and co-expression of SOAR and Orai1 in cells treated for 72 hrs with siSTIM1. All STIM1 fragments and Orai1 are N terminally tagged with EGFP and FLAG-mCherry, respectively. Scale bars are 15 microns and here and in Fig. S2, the same expression pattern was observed in 5 separate transfections and in all cells examined within each cover slip (n>20).

