
Figure 3.
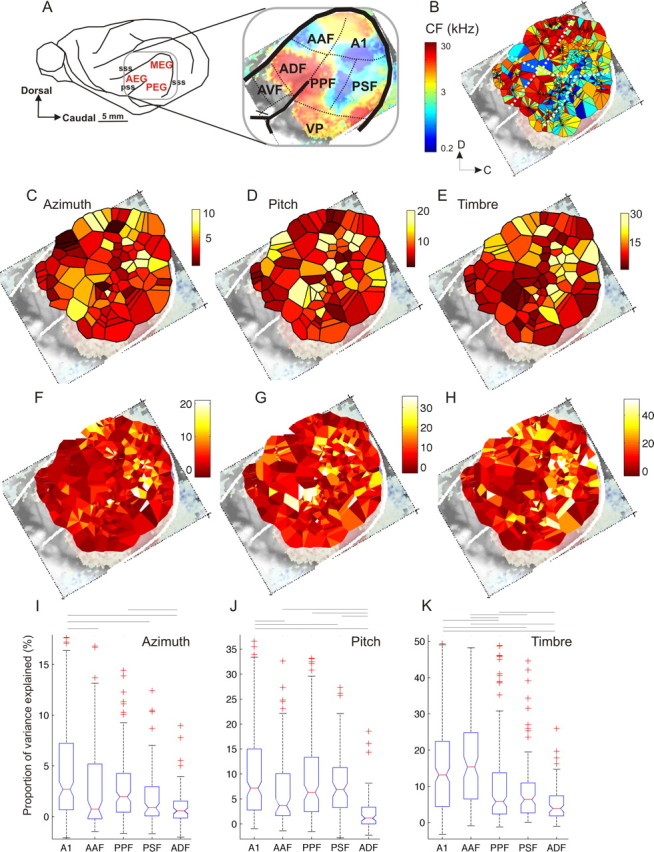
Distribution of relative sensitivity to location, pitch, and timbre across the auditory cortex. A, Location of ferret auditory cortex on the middle, anterior, and posterior ectosylvian gyri (MEG, AEG, and PEG, respectively). The inset shows the location of seven auditory cortical fields. The color scale shows the tonotopic organization as visualized using optical imaging of intrinsic signals (from Nelken et al., 2004). B, Voronoi tessellation map showing the characteristic frequencies (CFs) of all unit recordings made (n = 811). These data were collected from a total of five animals and have been compiled onto one auditory cortex map. Each tile of the tessellation shows the CF obtained from each recording site, using the same color scale as in A. C–E, Voronoi tessellation maps plotting the proportion of variance explained by each of the stimulus dimensions: azimuth (C), pitch (D), and timbre (E). Each tile represents the average value obtained at that penetration. All units included in the variance decomposition are shown (n = 619). F–H, as C–E, but here each individual unit is plotted, with tiles representing units from a single penetration arranged counterclockwise by depth around the penetration site. I–K, Box-plots showing the proportion of variance explained by azimuth (I), pitch (J), and timbre (K) for each of the five cortical areas examined. The boxes show the upper and lower quartile values, and the horizontal lines at their “waist” indicate the median. In all cases, there was a significant effect of cortical field on the distribution of variance values (Kruskal–Wallis test, p < 0.001), and significant pairwise differences are indicated by the horizontal lines above the plots (Tukey–Kramer post hoc test, p < 0.05).