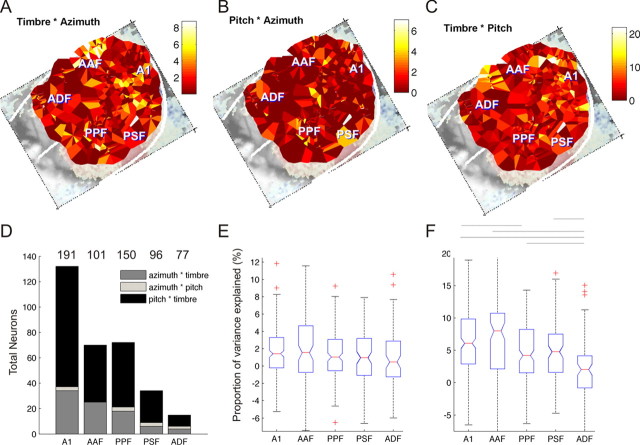
Figure 4.
Nonlinear sensitivity to stimulus combinations. A–C, Maps showing the distributions of neural sensitivity attributable to (proportion of response variance explained by) timbre × azimuth (A), pitch × azimuth (B), or timbre × pitch (C) nonlinear two-way interactions. D, Histogram showing the number of units in each field in which there were significant two-stimulus interactions for each of these stimulus parameter combinations. The total number of units recorded in each cortical field are listed above. E, F, Box-plots summarizing the statistical distributions of the summed azimuth × timbre and azimuth × pitch interactions (E), and the pitch × timbre interactions (F). There was no significant difference in the distribution between fields for the interactions between spatial and nonspatial parameters shown in E (p = 0.24). In contrast, the magnitude of the pitch × timbre interactions did vary with cortical field (p < 0.001). Horizontal lines above the box-plots show which distributions had pairwise significantly different means (Tukey–Kramer post hoc test, p < 0.05).

