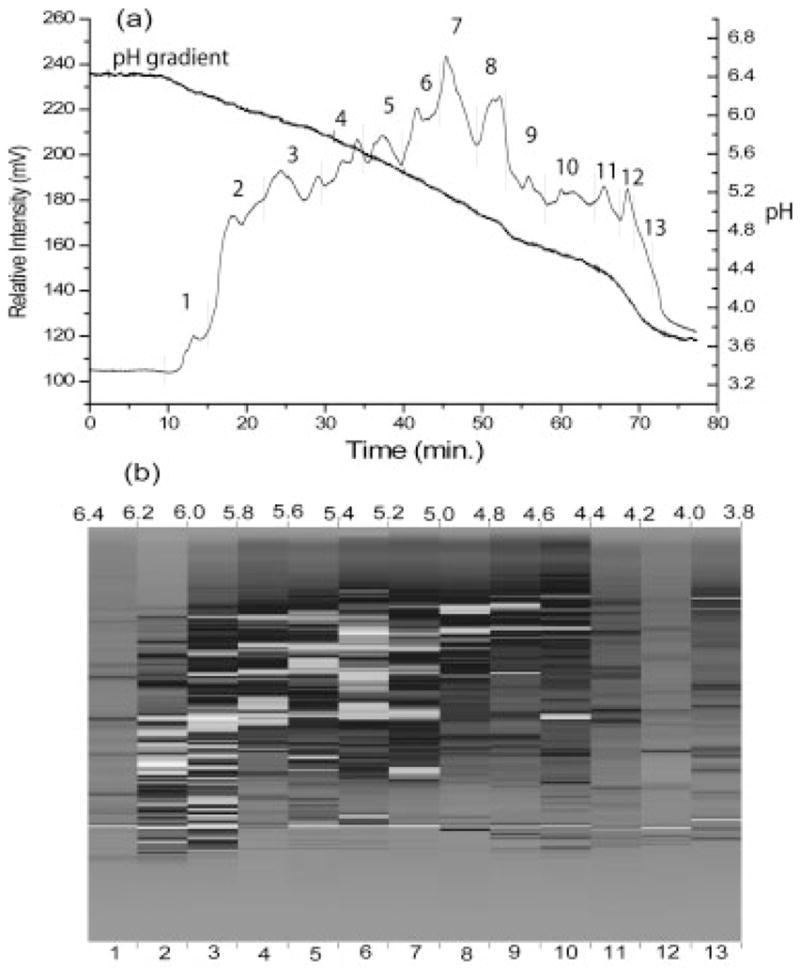
Figure 2.

(a) A CF chromatogram of the metastatic M4A4 cell line. The UV detector was set at 280 nm and the gradient was originated from pH 6.4 to 3.8 for 75 min. The fractions were collected at every pH 0.2 unit interval. (b) A 2-D UV map of M4A4 sample. Each grayscale band represents the relative intensity of each protein, from gray (lowest intensity) to white (highest intensity).
