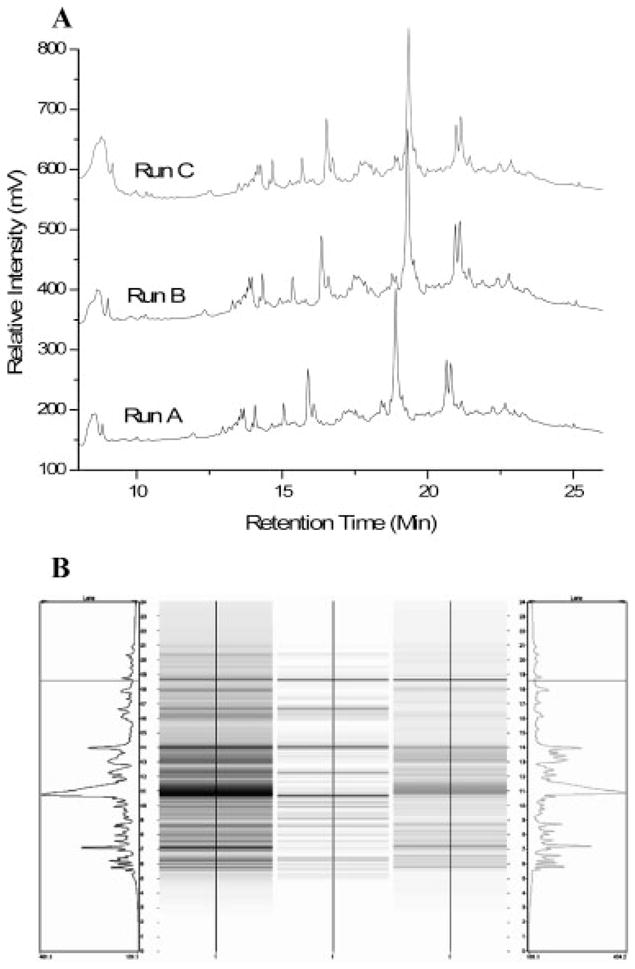
Figure 3.

(A) Reproducibility study of 2-D liquid separation. Three batches of samples from the metastatic cell line M4A4 were separated by CF. Spectra depict a single pH fraction from each run selected for RP-HPLC analysis. (B) Representative differential map (center) for comparison of protein expression in metastatic cells (left) and nonmetastatic cells (right).
