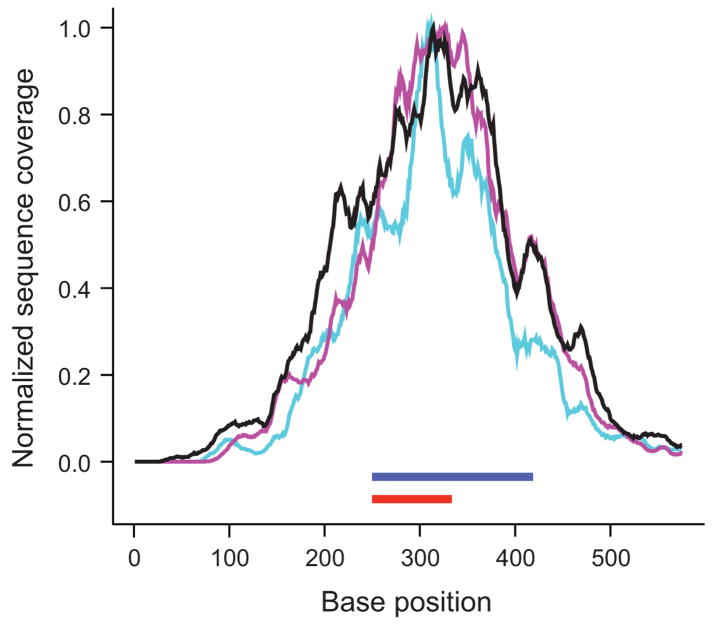
Figure 5.
Reproducibility of hybrid selection. For each exon (n = 15,565), the ratio of the mean coverage in two independent hybrid selection experiments performed on the same source DNA (NA15510) was plotted over its mean coverage in one experiment (a). Coverage was normalized to adjust for the different number of sequencing reads. The average ratio (black line) is close to 1. Standard deviations are indicated by purple lines. The graph on the right (b) shows base-by-base sequence coverage along one target in three independent hybrid selections, two of them performed on NA15510 (purple and teal lines) and one on NA11994 source DNA (black). Note the similiarities at this fine resolution of the three profiles which were normalized to the same height. The position of target exon (ENSE00000968562) and bait is indicated by red and blue bars, respectively.


