
Figure 5.
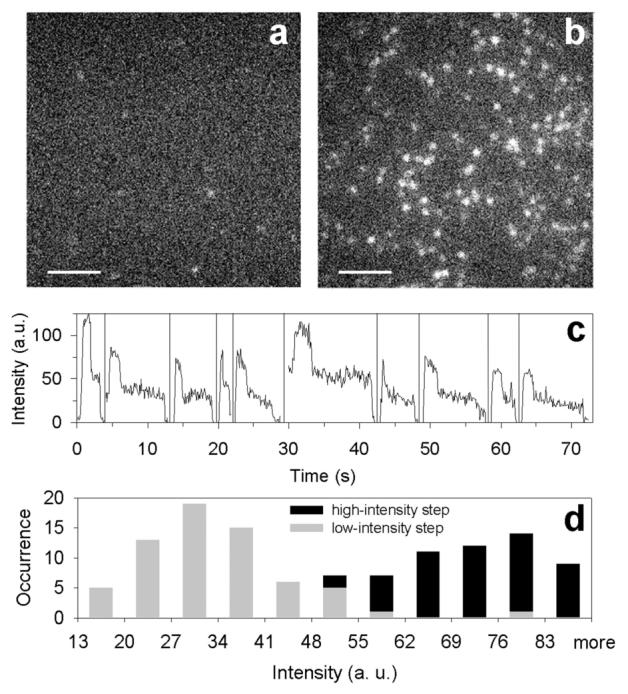
Single-molecule fluorescence images (256 × 256 pixels2; scale bar, 5 μm; 100 ms integration) of immobilized SQuID MB 4 (a) after buffer addition (control) and (b) 60 s after addition of 600 μM target DNA 3a. A similar experiment using a target with a single G mismatch (sequence 3b in Table 1) produced a sixfold smaller increase in the number of spots after target addition (data not shown). (c) Representative background-subtracted time traces for single molecules displaying two-step photobleaching, where the observation time scale is correct for the first molecule and the zero-time position for all other molecules has been horizontally offset for clarity. All traces show an initial increase due to focusing. (d) Histogram of the background-subtracted average intensity levels for molecules exhibiting two-step photobleaching after target addition (each molecule contributes two data points). The width of the distributions arises primarily from polarized, nonuniform illumination of the sample.