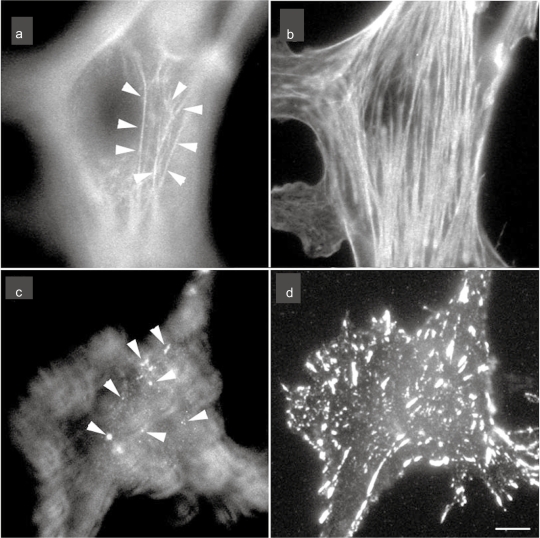
Figure 1.
The localization of stress fibers (a and d) and focal adhesion (c and d) in cultured endothelial cells. The cells were stained with rhodamine-labeled phalloidin for F-actin (stress fiber) visualization (a and b) or antivinculin for focal adhesion visualization (c and d). Micrographs are taken at two focal planes: a and c are adjusted at the apical portion of the cell; b and d are adjusted at the basal portion of the cell. Apical stress fibers are clearly visible (a; arrows) together with the typical basal stress fibers (b). Many of the anti-vinculin stained spots are observed at the apical portion of the cell (c; arrows) together with the staining of basal focal adhesions (d).
Note: Bar 20 μm.

