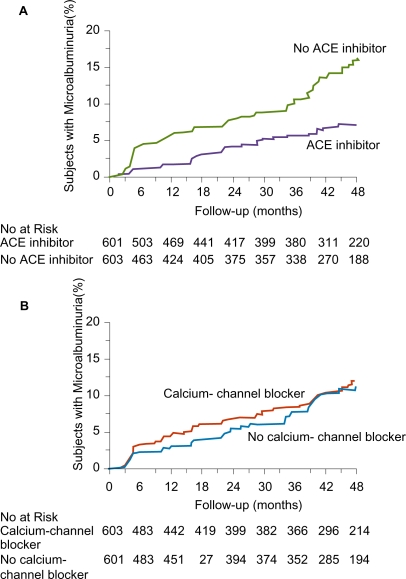
Figure 8.
Kaplan–Meier Curves for the Percentages of Subjects with Microalbuminuria during Treatment with or without ACE Inhibitors (Panel A) and with or without Non-Dihydropyridine Calcium-Channel Blockers (Panel B). The difference between the group that received ACE inhibitor therapy and the group that did not, adjusted for prespecified baseline covariates (see text) was significant (p < 0.001) according to the accelerated failure-time model. The difference between the group that received non-dihydropyridine calcium-channel blockers and the group that did not was not significant (p = 0.92). Reprinted with permission from Ruggenenti P, Fassi A, Ilieva AP, et al 2004. Preventing microalbuminuria in type 2 diabetes. N Engl J Med, 351:1941–51. Copyright 2004 © Massachusetts Medical Society. All rights reserved.

