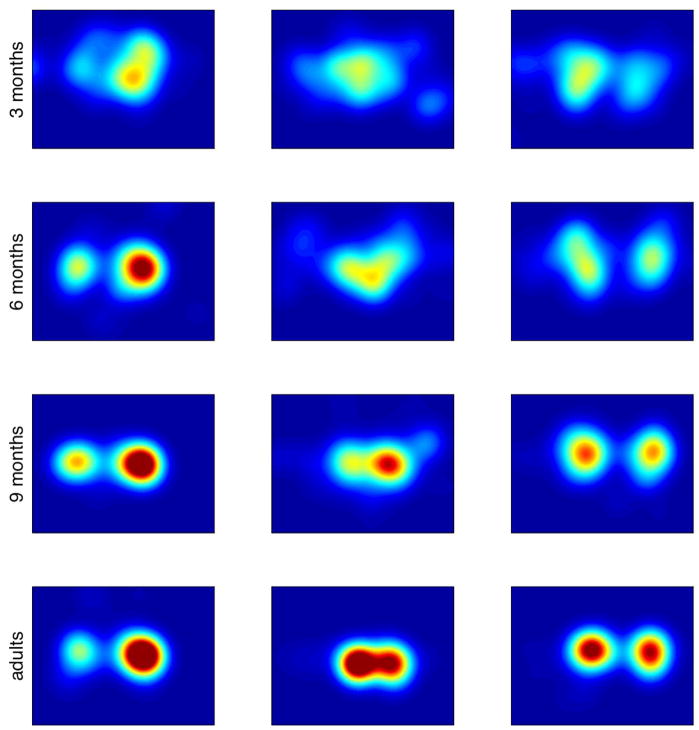
Figure 3.
Example kernel density estimates (averaged across time) corresponding to the clips shown in Figure 1. Rows are data from (top to bottom) 3-month-olds, 6-month-olds, 9-month-olds, and adults. Warmer colors indicate higher probability; probabilities are scaled equally across all images.

