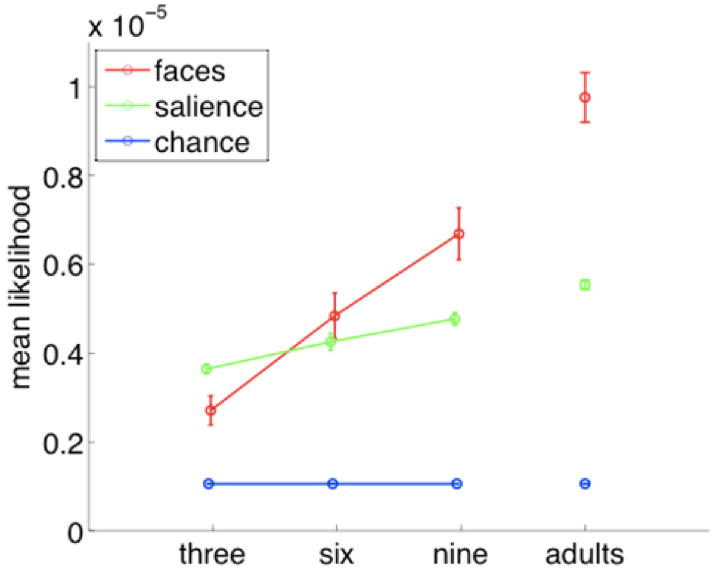
Figure 4.
Fit of face, low-level salience, and chance models to experimental data. Higher values indicate greater mean fixation probability for infants of that group. Error bars indicate standard error of the mean across participants. Because the likelihood of an infant fixating any given pixel is a priori very small, these probabilities are very low in absolute terms. Nonetheless, when examined relative to the two different models of fixation, they show reliable changes across groups.

