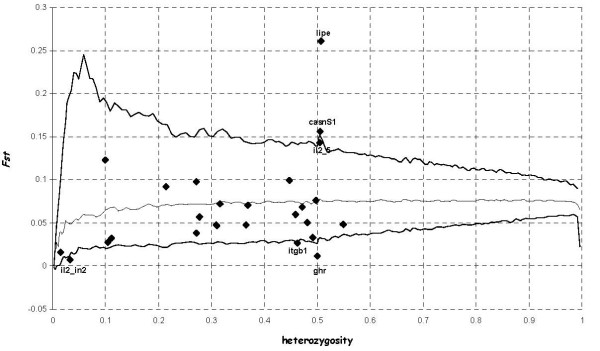
Figure 1.
Plot of FST against heterozygosity for the 27 SNPs analysed. Distribution of FST values as a function of the within-population heterozygosity (HS) based on the 27 goat SNPs analysed. The envelope of values corresponds to neutral expectations (with FST = 0.078) in the infinite-allele model constructed according to the method of Beaumont and Nichols [21], with a confidence level set to 95%.

