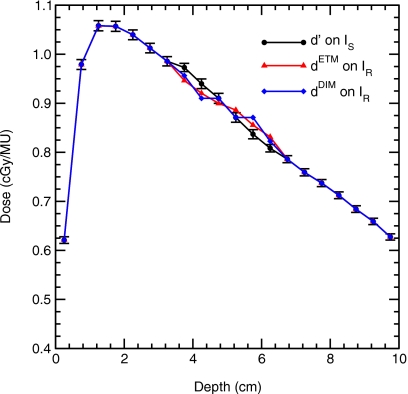
Figure 8.
Central axis depth-dose profiles computed in the geometry indicated in Fig. 7 with source A. The deformation was confined to voxels whose centers are located at depths of 3.75–6.25 cm. One standard deviation statistical error bars are shown on the d′ only, statistical errors in dETM and dDIM are of the same size. However, deviations between the dETM and dDIM are not statistical due to the correlated method of scoring the data.

