Figure 2.
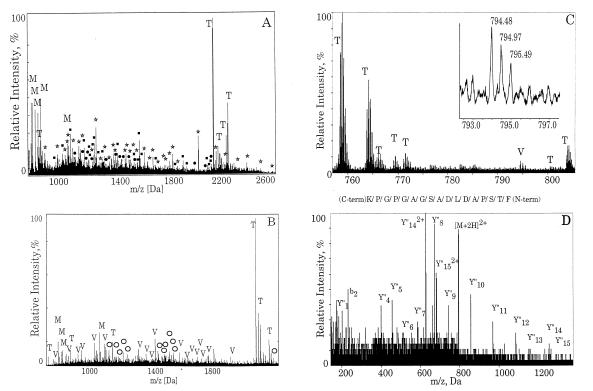
Use of mass spectrometry to identify Vav-2 and to resolve protein mixtures. Proteins separated by SDS/PAGE shown in Fig. 1 were subjected to in-gel digestion by trypsin and analyzed by mass spectrometry. (A) Protein band 6 was analyzed by MALDI. The tryptic peptides from the digest indicate the presence of several proteins in this mixture. Filled squares correspond to peptides derived from EGFR, T refers to trypsin autolysis products, and M denotes matrix ions. The peaks marked with stars denote a novel protein. Peaks marked with filled circles correspond to Eps15 (confirmed by MS/MS). (B) Protein band 4 was analyzed by MALDI. The tryptic peptides from this band showed the presence of peptides corresponding to Vav-2 (labeled V) and Hrs (shown by open circles). T refers to trypsin autolysis products and M denotes matrix ions. (C) MS spectrum from nanoelectrospray MS/MS analysis of the peptides from the sample analyzed by MALDI in B. V shows a peak corresponding to Vav-2, and T refers to trypsin autolysis products and their sodium adducts. (Inset) Isotopic resolution of a doubly charged peptide corresponding to Vav-2. (D) Fragmentation of the doubly charged peptide ([M+2H]2) shown in C (m/z = 794.48) by MS/MS. The Y" series of ions (C-terminal fragments) that are produced due to fragmentation are shown as well as one from the B series (N-terminal fragments; b2). The sequence of the peptide derived from this spectrum is shown at the top of the panel.

