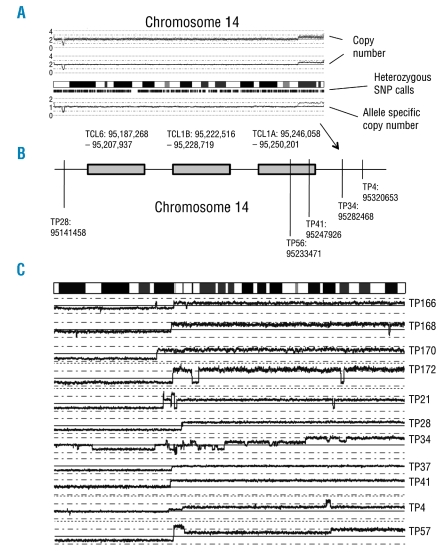
Figure 2.
Breakpoints of unbalanced translocations involving the TCL1 locus and breakpoints on chromosome 8. (A) A view of chromosome 14 in sample TP34 showing a duplication of the chromosomal region 14q32.13 – 14q32.33 harboring a breakpoint in the TCL1 locus. Similar unbalanced translocations were detected in four other samples, and their breakpoints in relation to the three putative oncogenes TCL6, TCL1B and TCL1A are displayed in the lower panel (B). (C) T-PLL commonly displays a loss of chromosome 8p and gain of 8q. The regions of chromosomal breakpoints leading to this imbalance, as analyzed by high density SNP arrays are displayed. The images show that the breakages are frequently of highly complex nature, containing multiple changes of copy number and breakpoints in individual samples.

