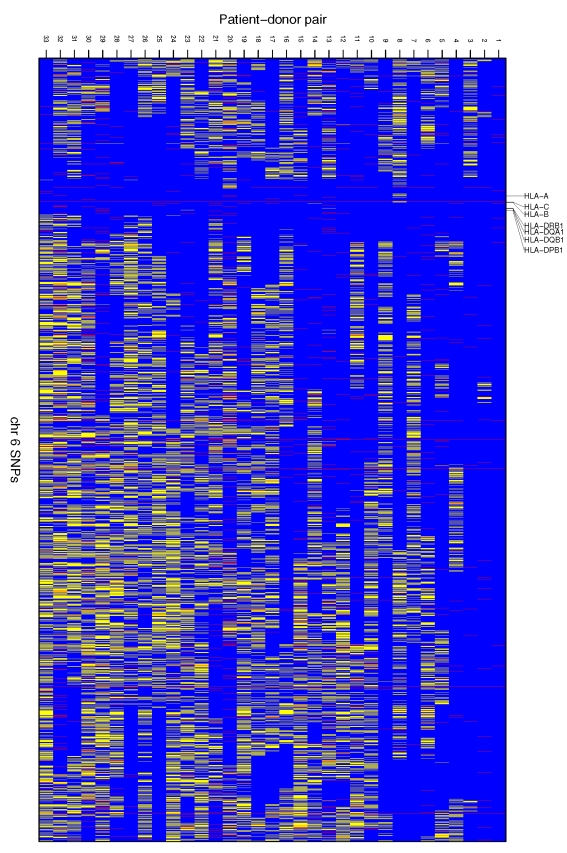
Figure 1.
The SNPs on chromosome 6 IBS between HSCT sibling pairs. Blue stripes represent similar genotypes and yellow stripes different genotypes between siblings. Red stripes are SNPs where genotyping of either patient or donor was not successful and thus no similarity could be determined. Note: Markers in Figure 1 are not in physical scale; i.e. each blue, yellow or red stripe represents one SNP, and the distance between neighbouring SNPs differs along the chromosome.

