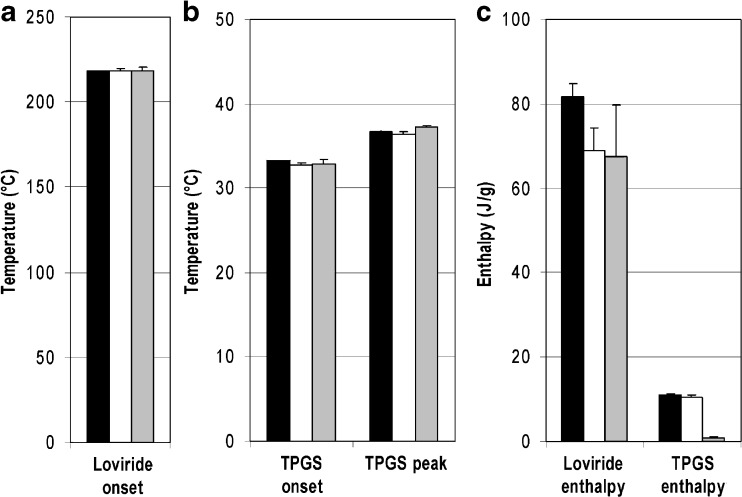
Fig. 8.
DSC results: onset temperatures of the melting endotherm of loviride a, onset and peak temperatures of the TPGS melting endotherm b, and enthalpy of fusion of both peaks c. Key: reference formulation (black bars), miniaturized and dried in air (white bars), and miniaturized and freeze-dried (gray bars)

