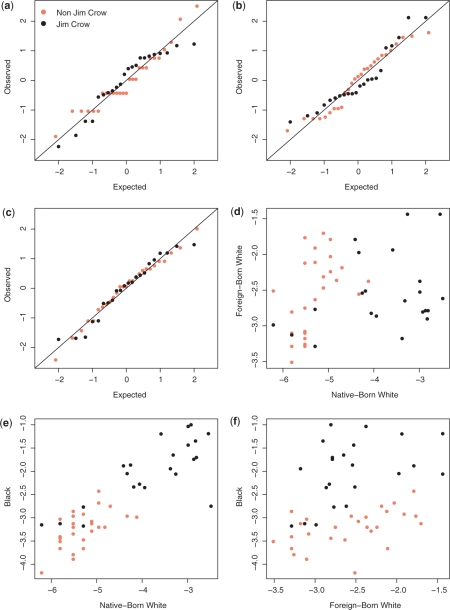
Figure 2.
Log odds of illiteracy by Jim Crow status and race. Panels (a)–(c) give normal QQ plots, for native-born whites, foreign-born whites and blacks, respectively (the log odds are standardized). Bivariate scatterplots for: (d) foreign-born white versus native-born white, (e) black versus native-born whites, (f) black versus native-born white. Orange/black points correspond to states without/with Jim Crow laws in place

