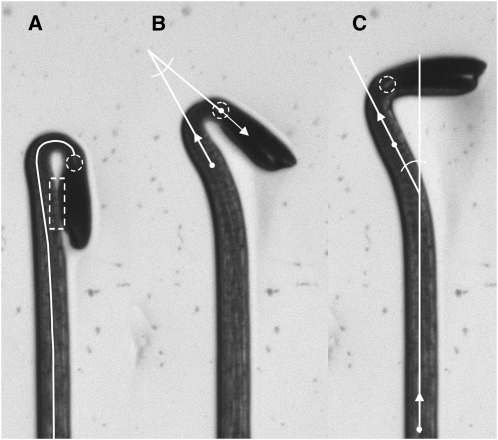
Figure 1.
Images of a seedling responding to light with features related to the HYPOTrace method superimposed. A, Midline shown as a solid white line, hypocotyl terminus feature indicated with a dashed white circle, and region of cotyledons appressed to the hypocotyl indicated by dashed white rectangle. Changes in the midline length between images in a time series were used to quantify growth rate. B, Angle formed by the first principal component direction of the terminal point and the first principal component direction at a more basal reference point. This angle was used to quantify apical hook opening over time. C, Angle formed by the first principal component direction of a point at the hypocotyl base and the first principal component direction of the reference point shown in B. This hypocotyl direction angle was taken as a measure of phototropic bending.

