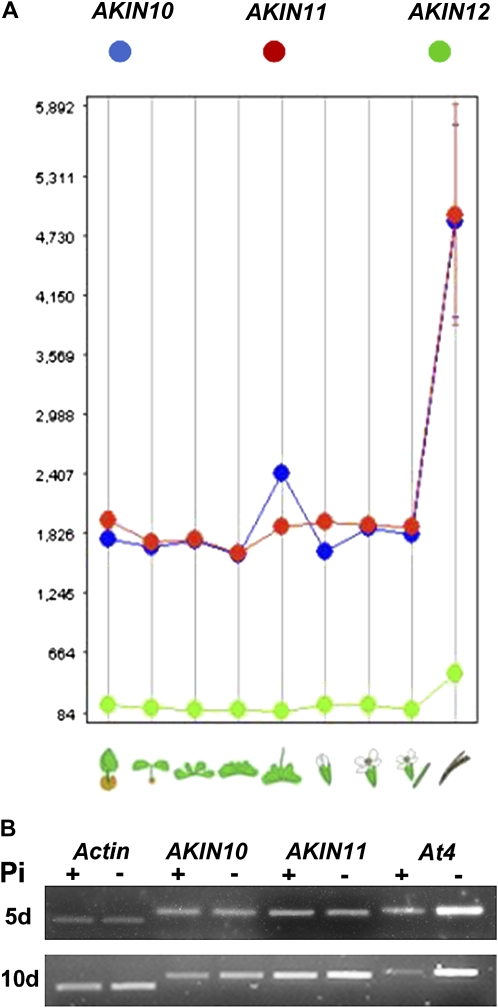
Figure 2.
A, Average signal of gene expression for AKIN10, AKIN11, and AKIN12 derived from the microarray data available at the Genevestigator database (Zimmermann et al., 2005) and arranged according to tissue. B, Effect of Pi starvation on the accumulation of AKIN10 and AKIN11 transcripts. RT-PCR of total RNA from rosette leaves from plants grown for 5 and 10 d under Pi-sufficient (+) and Pi-starvation (−) conditions. At4 is a Pi-starvation control gene, and actin was used as an internal control. [See online article for color version of this figure.]

