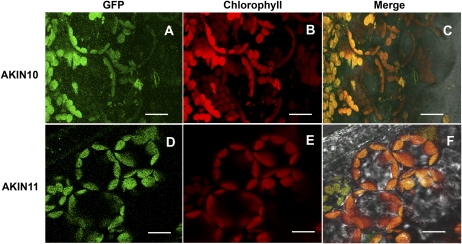
Figure 3.
Confocal fluorescence images of AKIN10 and AKIN11 fusion proteins showing localization at the chloroplast. The GFP signal and the chlorophyll autofluorescence are indicated in green and red, respectively. The merged images (Merge) of chlorophyll autofluorescence, GFP, and light field are shown. Bars = 10 μm. [See online article for color version of this figure.]

