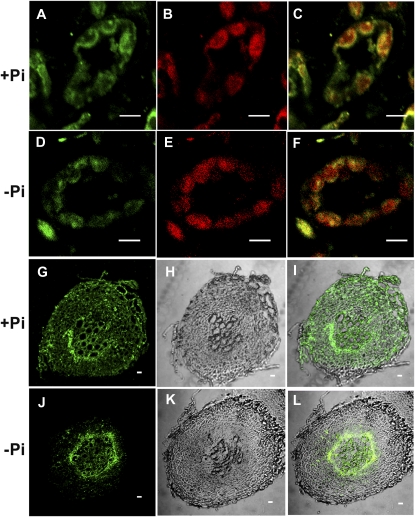
Figure 4.
Immunolocalization of the catalytic subunits. Leaf and root sections of plants grown with or without Pi were immunolocalized with anti-α-antibodies. A to C, Leaf sections of plants grown under +Pi conditions (60×). D to F, Leaf sections of plants grown under −Pi conditions (60×). G to I, Roots grown under +Pi conditions (40×). J to L, Roots grown under −Pi conditions (40×). A, D, G, and J show goat anti-rabbit Alexa 568 fluorochrome staining (green signal). B and E show chlorophyll (red signal). H and K show bright-field images of the transverse sections of roots. C and F are overlaid images of Alexa 568 fluorochrome and chlorophyll for colocalization. I and L are overlaid images of Alexa 568 and bright field. Bars = 10 μm. [See online article for color version of this figure.]

