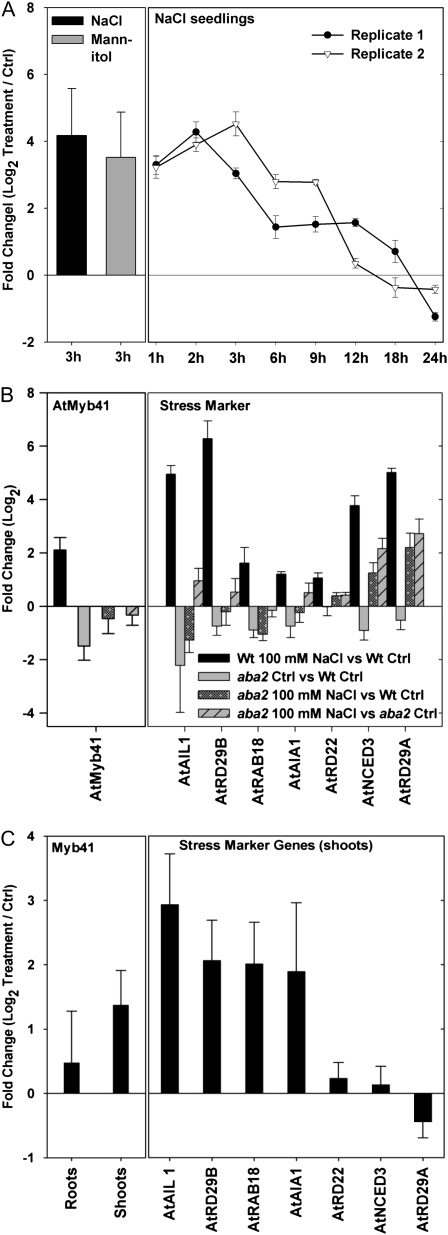
Figure 1.
A, Expression of AtMyb41 in 9-d-old seedlings after 3 h of treatment with 100 mm NaCl or 200 mm mannitol (left panel; data represent means ± sd of three independent replicates) and after 24 h of treatment with 100 mm NaCl (right panel; data from two independent experiments are shown separately, with error bars representing sem from three biological replicates). Ctrl, Control. B, Expression of AtMyb41 (left) and stress marker genes (right) after 3 h of 100 mm NaCl treatment in 9-d-old aba2 mutant and wild-type seedlings. Data represent means ± sd of three independent replicates. Black bars represent salt-stressed wild type (Wt) versus control wild type (Wt Ctrl); gray bars represent control aba2 versus control wild type; dotted black bars represent salt-stressed aba2 versus control wild type; striped gray bars represent salt-stressed aba2 versus control aba2. C, Expression of AtMyb41 (left) and stress marker genes (right) in hydroponically grown 4-week-old plants. Plants were treated with increasing salt concentrations, reaching 50 mm NaCl in the final week. Data represent means ± sd of three independent replicates. The Arabidopsis Genome Initiative codes of the genes are provided in Supplemental Table S4.

