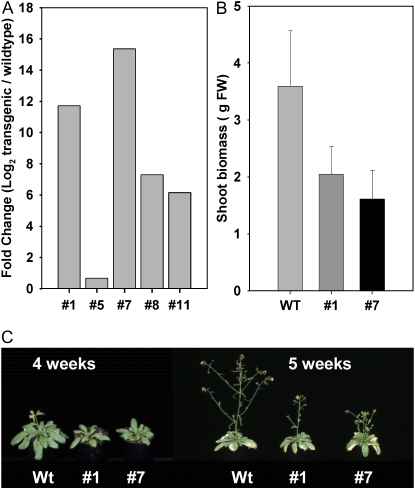
Figure 2.
A, Analysis of transgene expression in AtMyb41-overexpressing lines using quantitative real-time RT-PCR. B, Growth of AtMyb41-overexpressing plants compared with wild-type plants, as estimated by shoot biomass. Data represent means ± sd of 45 plants from eight independent replicates, harvested before bolting. FW, Fresh weight; WT, wild type. C, AtMyb41-overexpressing plants from lines 1 and 7 compared with wild-type (Wt) plants at 4 and 5 weeks after sowing.

