Figure 3.
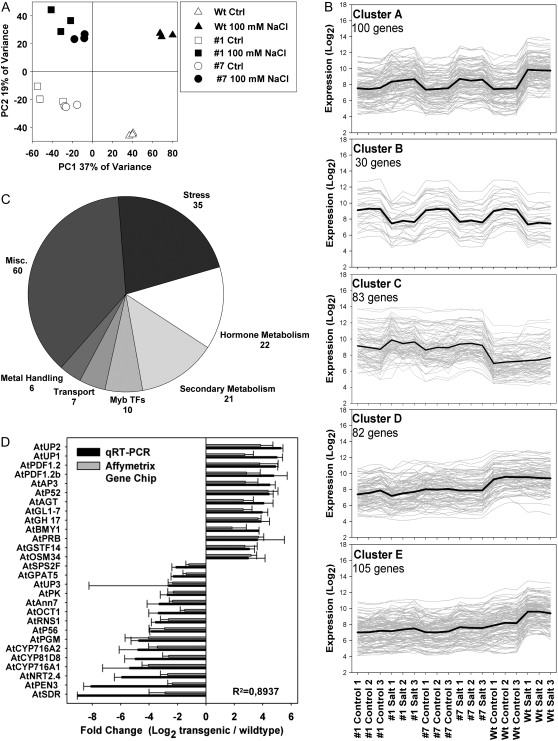
A, Principal component analysis of the transcriptomic profiles obtained from three independent biological replicates of each genotype and treatment. The first two principal components are shown, which constitute the major variation of the data set. Ctrl, Control; Wt, wild type. B, K-means clustering of the genes declared to be changed (FDR P < 0.05, >1.5-fold changed in log2 scale) in AtMyb41 overexpressors versus the wild type and treatment versus control. Cluster A, Salt-induced genes; cluster B, salt-repressed genes; cluster C, genes up-regulated in the transgenic lines; cluster D, genes down-regulated in the transgenic lines; cluster E, salt-induced genes in the wild type but not in the transgenic lines. C, PageMan statistical overrepresentation analysis of genes significantly changed in expression due to AtMyb41 overexpression (genes only responding to salt stress were excluded). D, Comparison of microarray and quantitative real-time RT-PCR (qRT-PCR) data (data represent means ± sd of two overexpressing lines under control conditions in three independent experiments) of selected genes found significantly changed in the transcriptomic profiles. The Arabidopsis Genome Initiative codes of the genes are provided in Supplemental Table S4.

