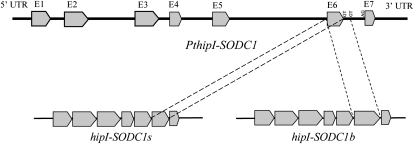
Figure 3.
Organization of the PthipI-SODC1 gene. Schematic representation of the PthipI-SODC1 gene and transcripts of hipI-SODC1s and hipI-SODC1b. Pointed gray boxes represent exons, and thick lines between them represent introns. Consensus sequences corresponding to the splice donor and acceptor sites are shown.

