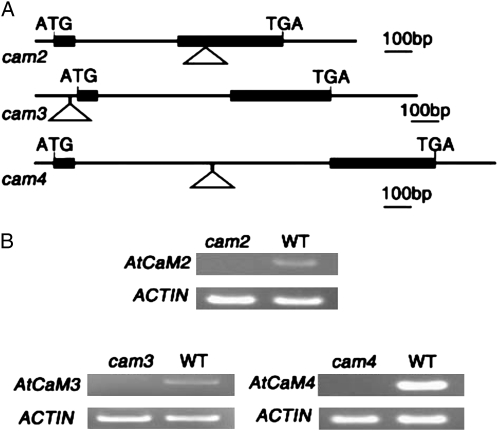
Figure 1.
Isolation and identification of cam2, cam3, and cam4 T-DNA insertional mutants. A, The intron-exon organization of AtCaM2, AtCaM3, and AtCaM4 and the locations of the T-DNA insertions. The black boxes represent exons, lines indicate introns and untranslated regions, and the positions of the T-DNA insertions are indicated by triangles. B, RT-PCR analyses to detect AtCaM2, AtCaM3, and AtCaM4 transcripts in RNA extracts from 10-d-old wild-type (WT) and mutant seedlings. Actin expression levels were used as a control.

