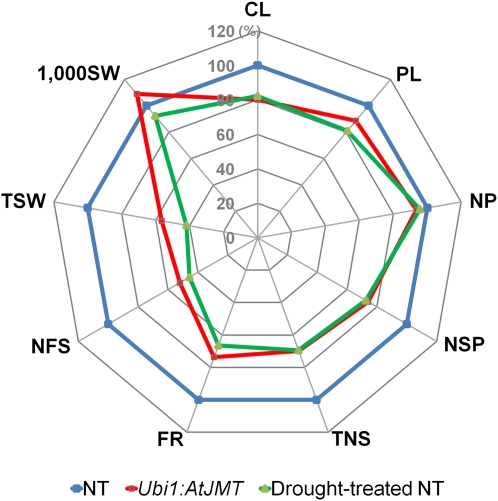
Figure 3.
Comparison of agronomic traits between Ubi1:AtJMT and drought-treated NT plants. A spider plot of Ubi1:AtJMT plant (red) and drought-treated NT plant (green) agronomic traits as compared with untreated NT plants (blue). Each data point represents a percentage of the mean values (n = 15) listed in Table II (summer). Mean values from untreated NT plants were set at 100% as a reference. CL, Culm length; PL, panicle length; NP, number of panicles per plant; NSP, number of spikelets per panicle; TNS, total number of grains; FR, filling rate; NFS, number of filled seeds; TSW, total seed weight; 1,000SW, 1,000 seed weight.

